Lifetime projection
See the whole plan, year by year.
Trace your whole lifetime of net worth in one view, then choose any year to see the income, taxes, spending, property, and accounts behind it.
Explore lifetime projection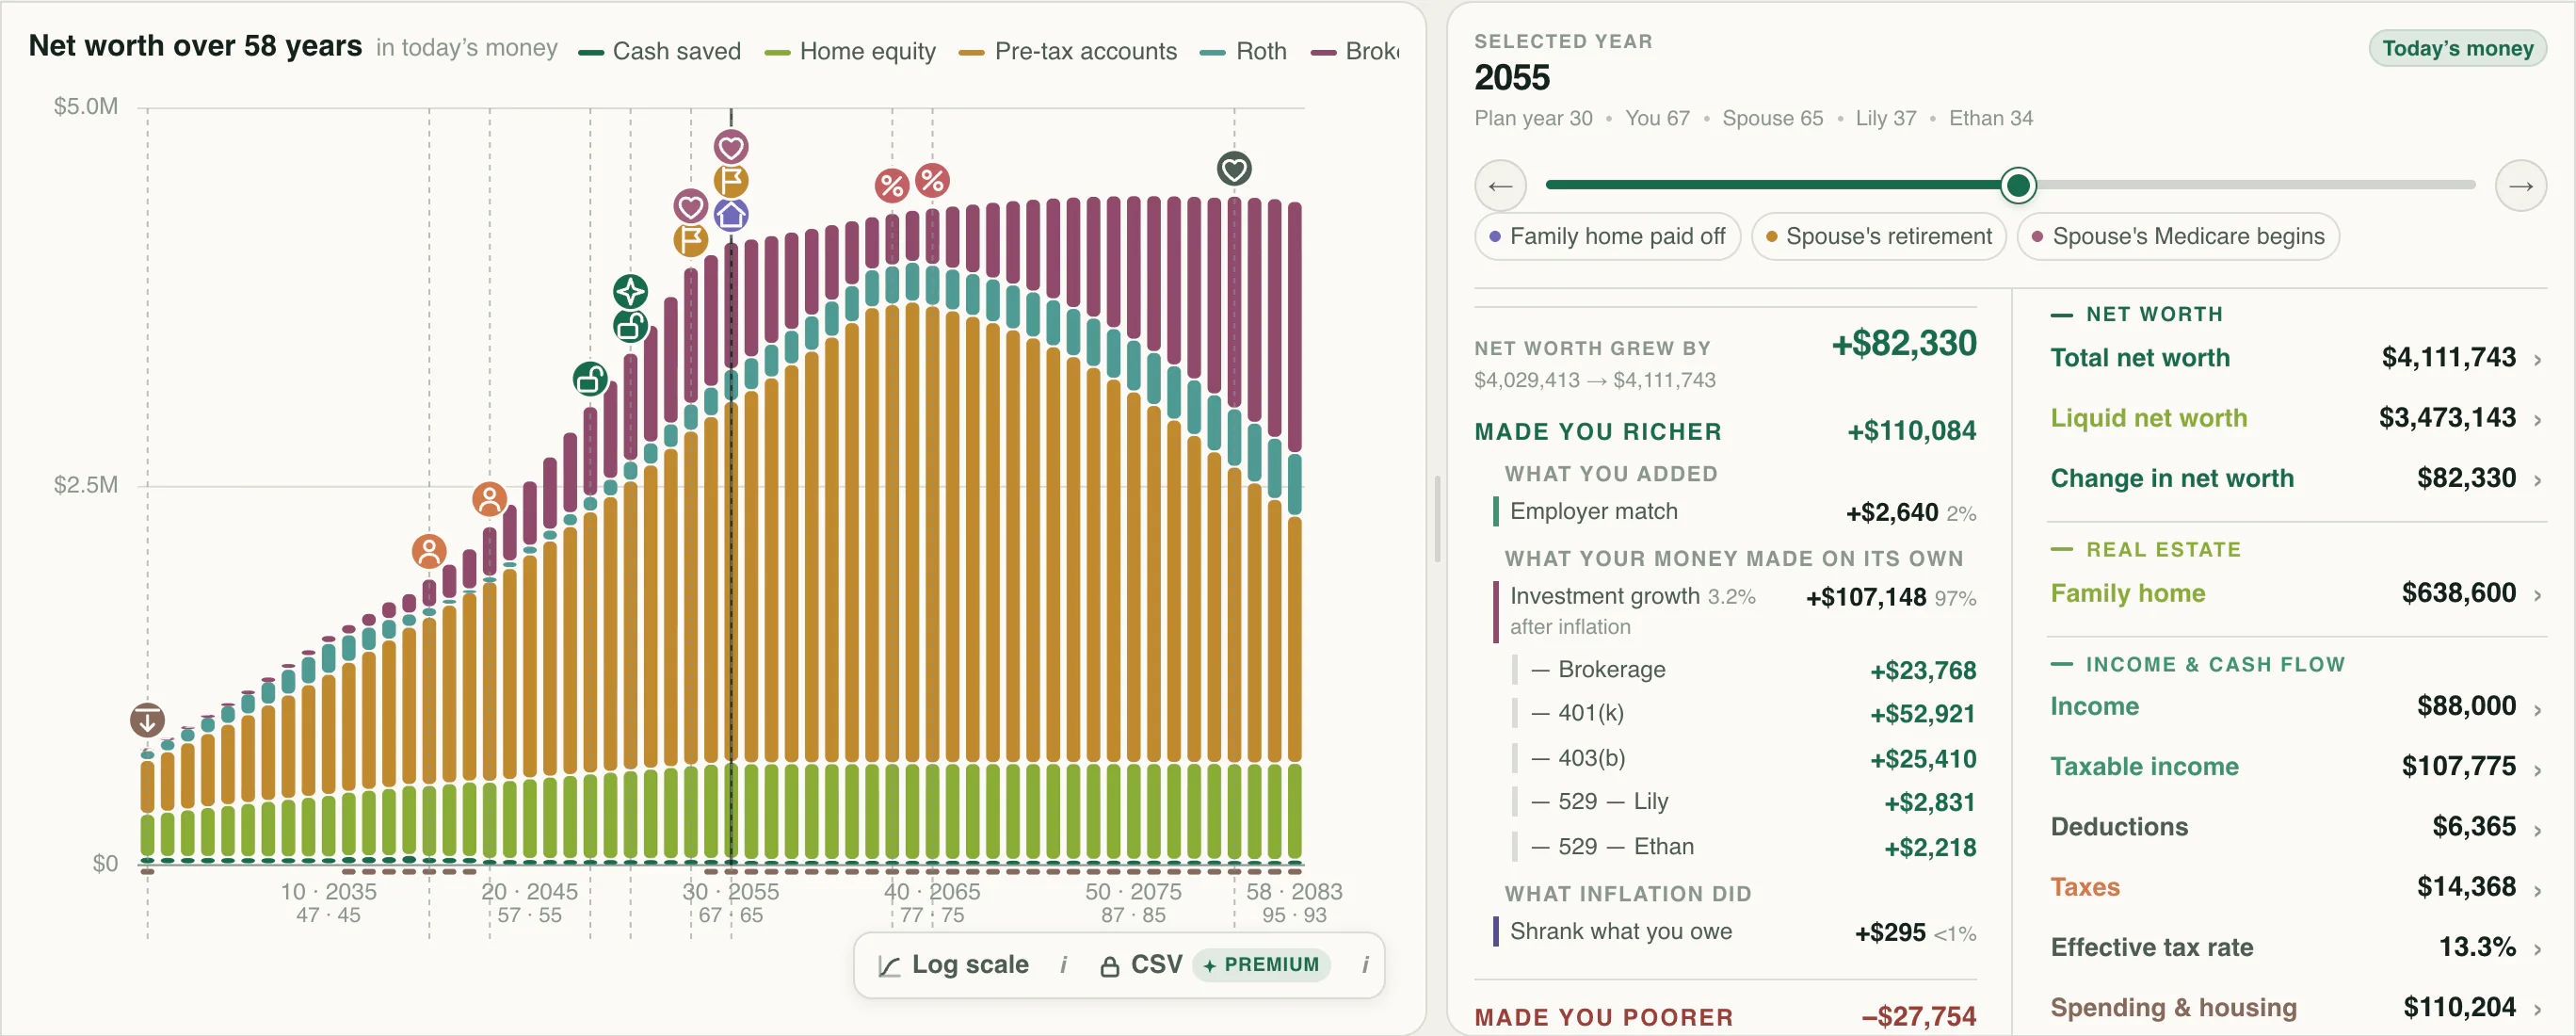
One life. Many versions of it.
Financial planning software for the life you want to explore. Compare retirement dates, follow your cash flow and net worth, and see how today’s choices could shape your future.
What if I retire next year?
See what an earlier finish line asks of your savings today.
The people behind MoneyWhatIf
With backgrounds at
With experience at
How the pieces fit together
MoneyWhatIf brings current finances, future choices, and the details behind the forecast into one connected planning process.
Describe your household, income, everyday spending, property, debts, and investment accounts. Add retirement dates and the assumptions you want to explore. You can begin with estimates and refine the entries as your picture becomes clearer.
Try a different retirement date, a new home, a career break, or another saving rate. What-If keeps the original forecast in view while the change flows through the plan’s income, taxes, spending, and future balances.
Open a year to trace its money flow, review the tax picture, and see which accounts fund spending. Use historical simulations to explore market uncertainty, then keep the choices you want to revisit and share the plan for a conversation.
Inside the forecast
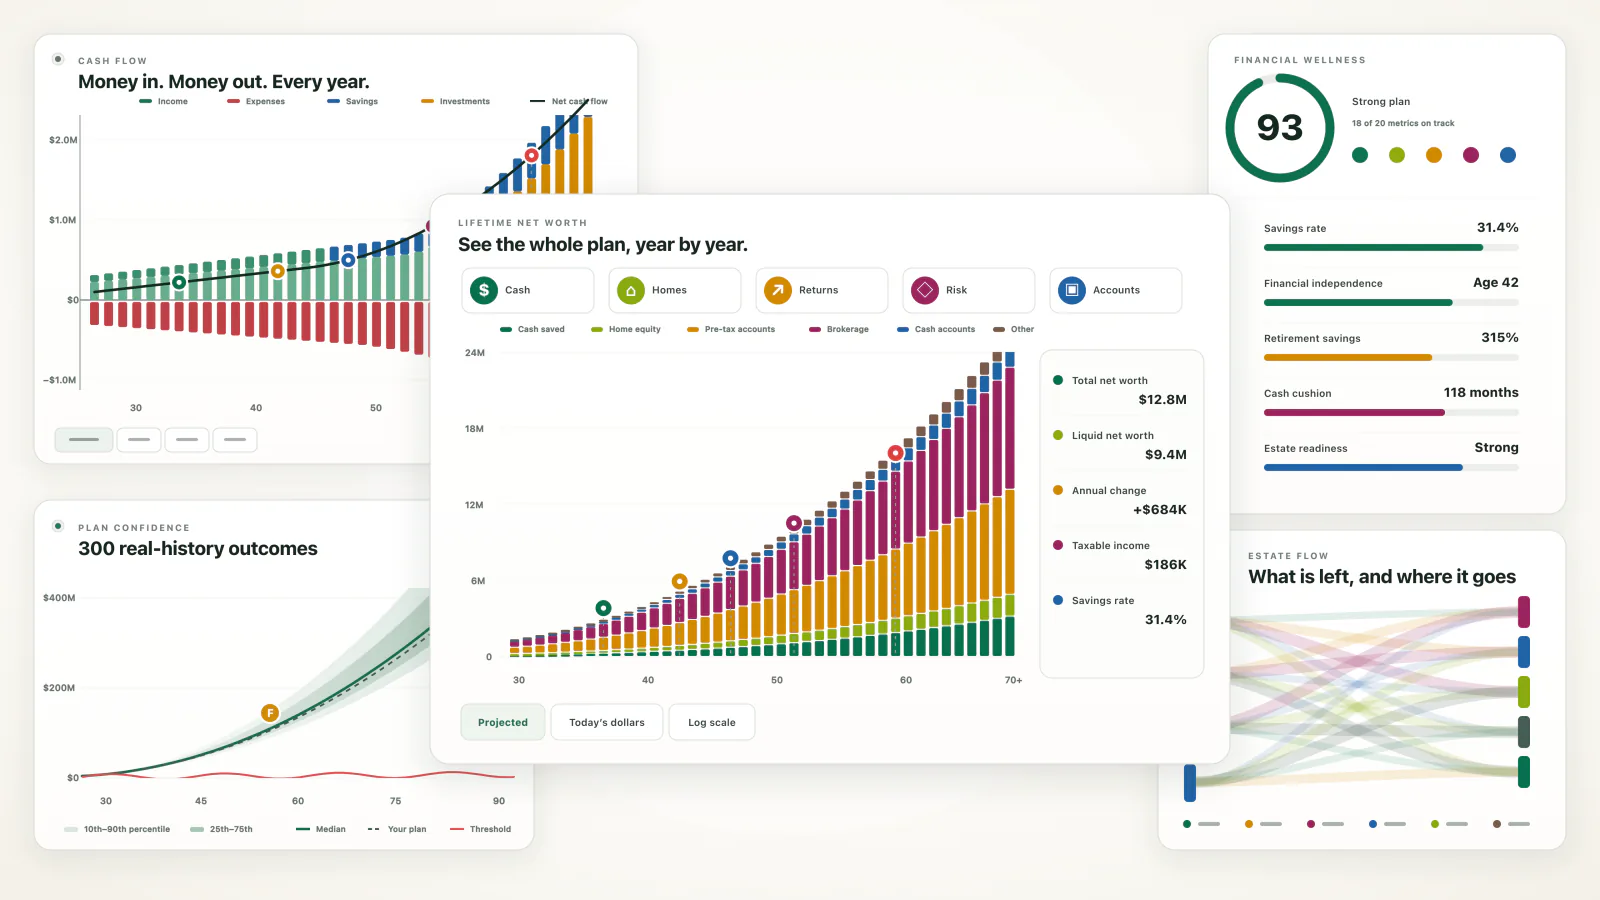
Start with the lifetime picture, open the years that matter, and keep following the same numbers through resilience, wellness, and legacy.
Lifetime projection
Trace your whole lifetime of net worth in one view, then choose any year to see the income, taxes, spending, property, and accounts behind it.
Explore lifetime projectionCash flow
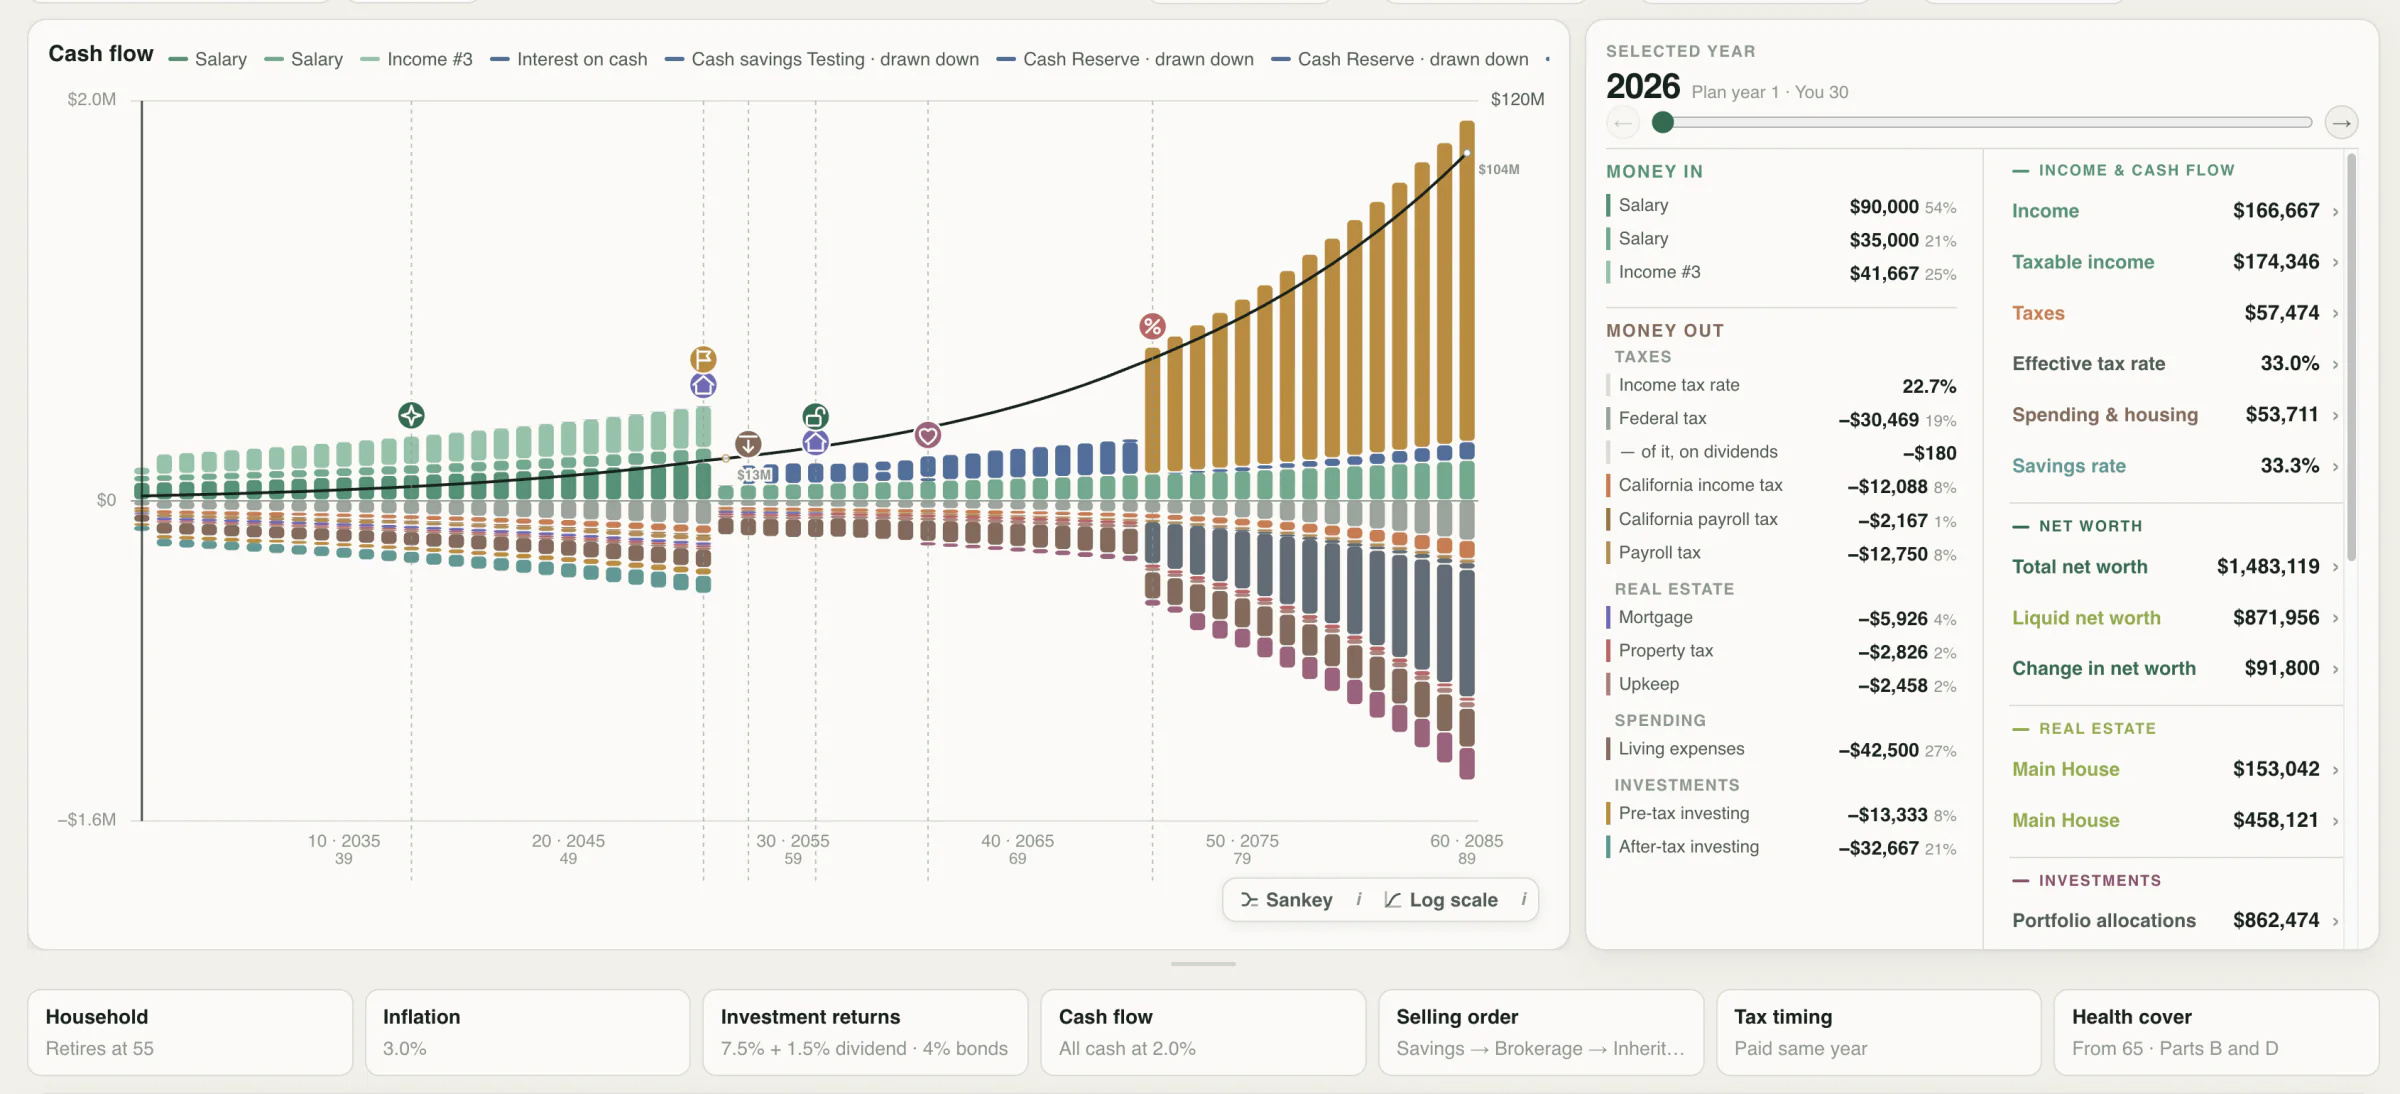
Watch inflows and outflows change across your lifetime, then open any year to trace each income source into taxes, housing, investing, and cash kept on hand.
Explore cash flow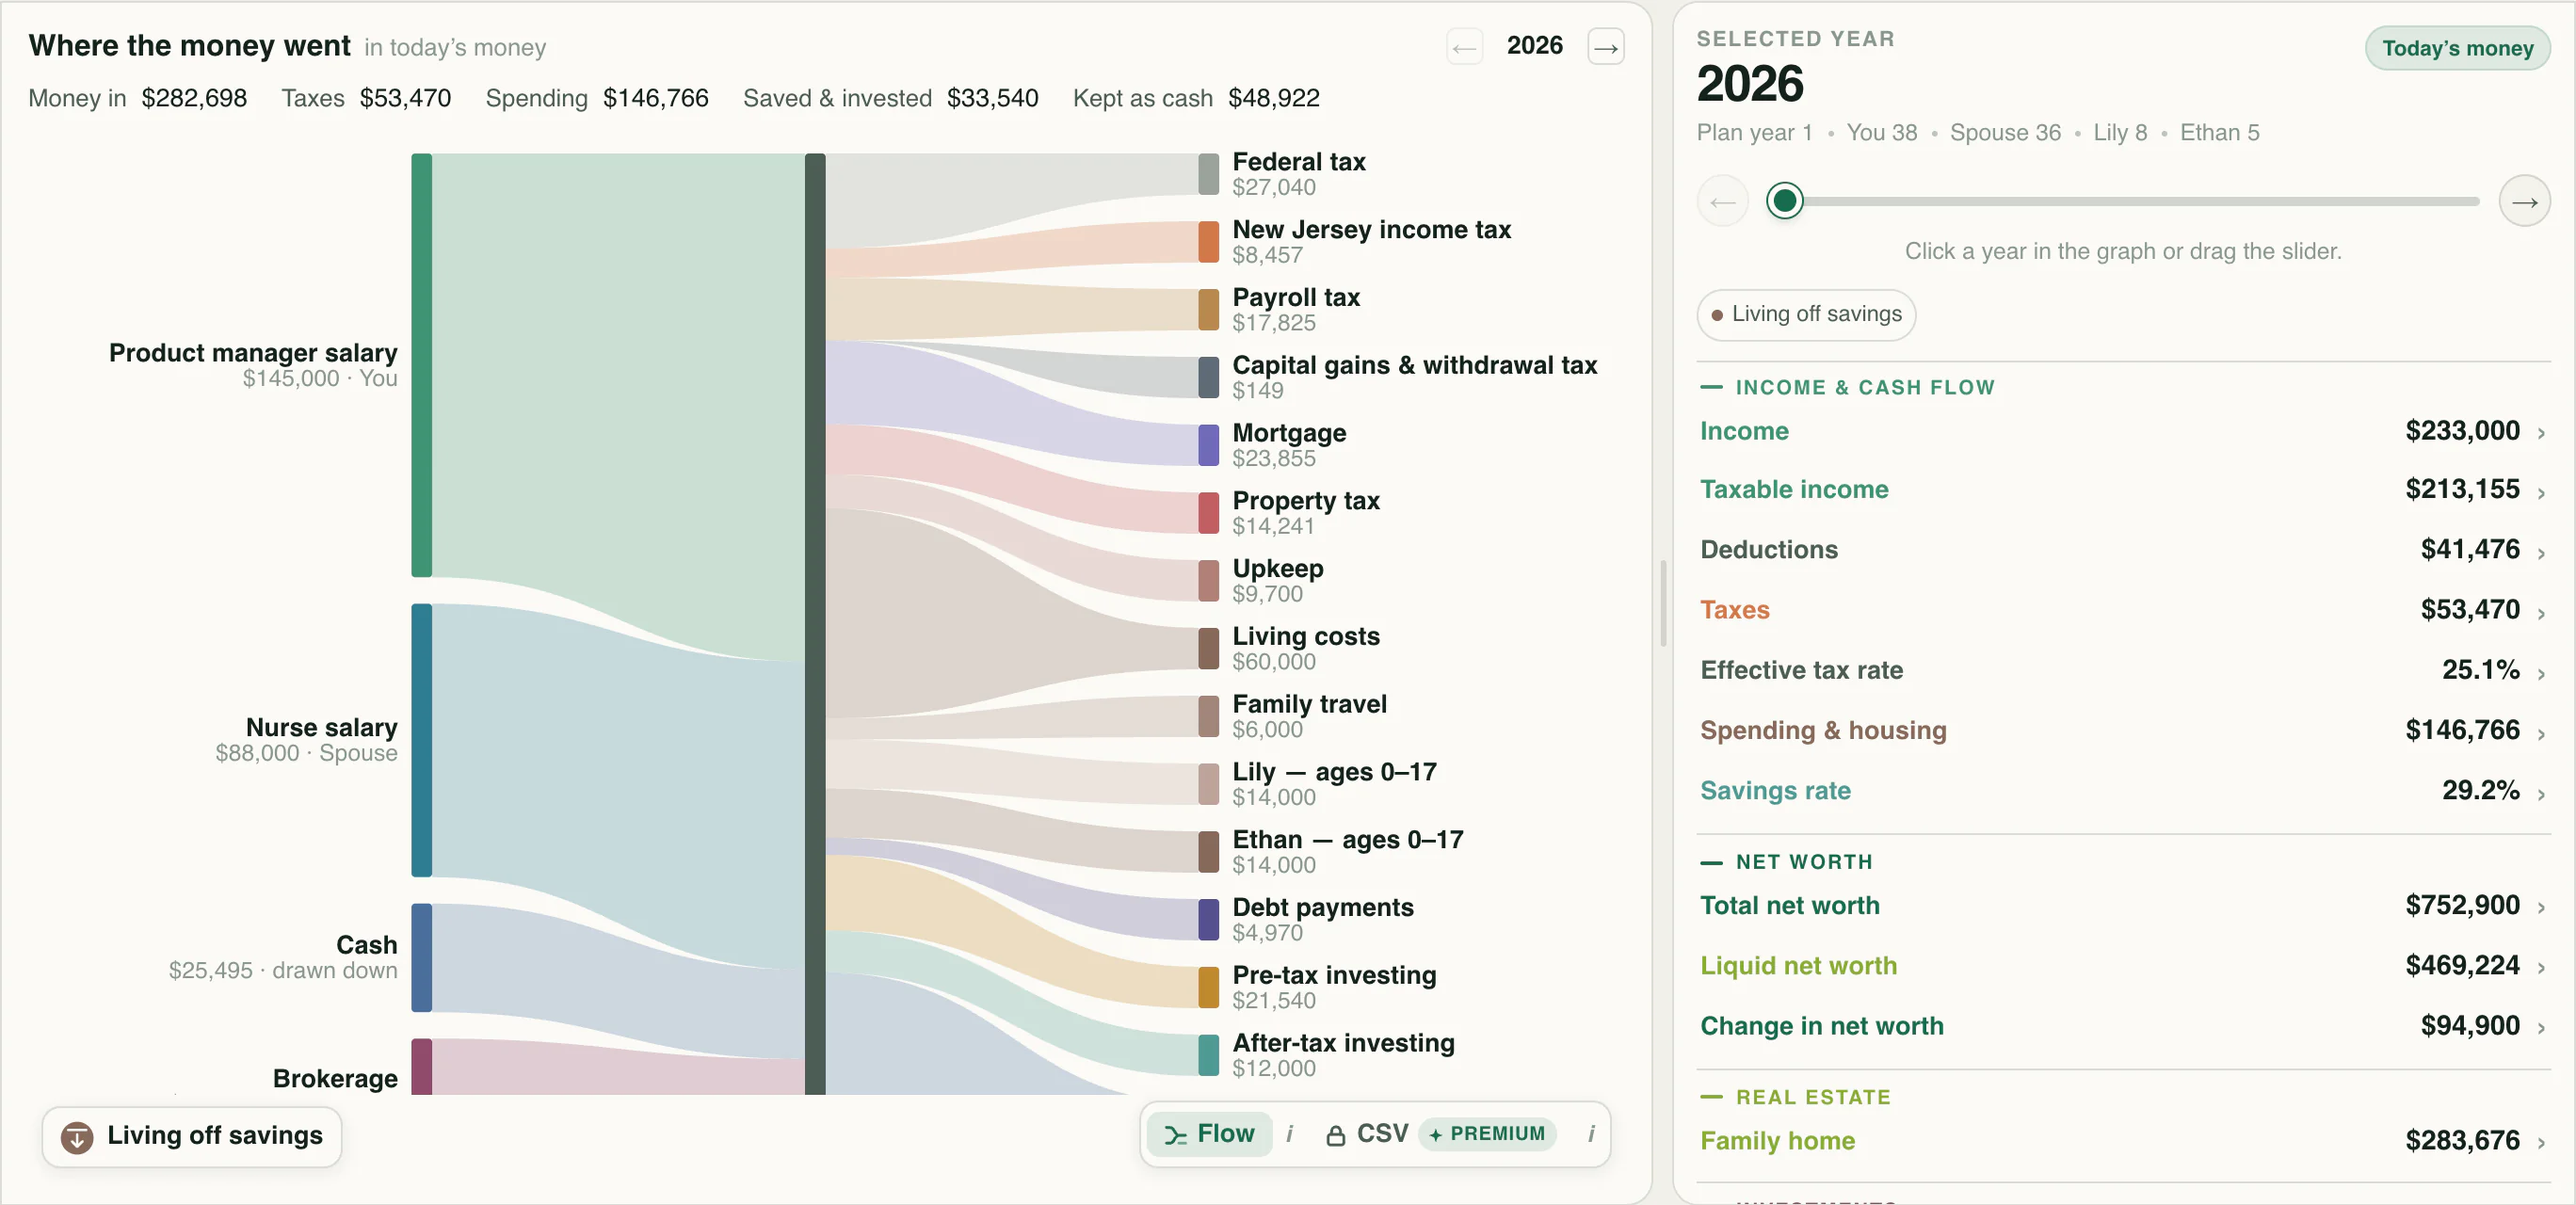
Financial wellness
Turn a dense forecast into direct answers: when work becomes optional, whether retirement savings meet the need, how long cash lasts, and what deserves attention.
Explore financial wellness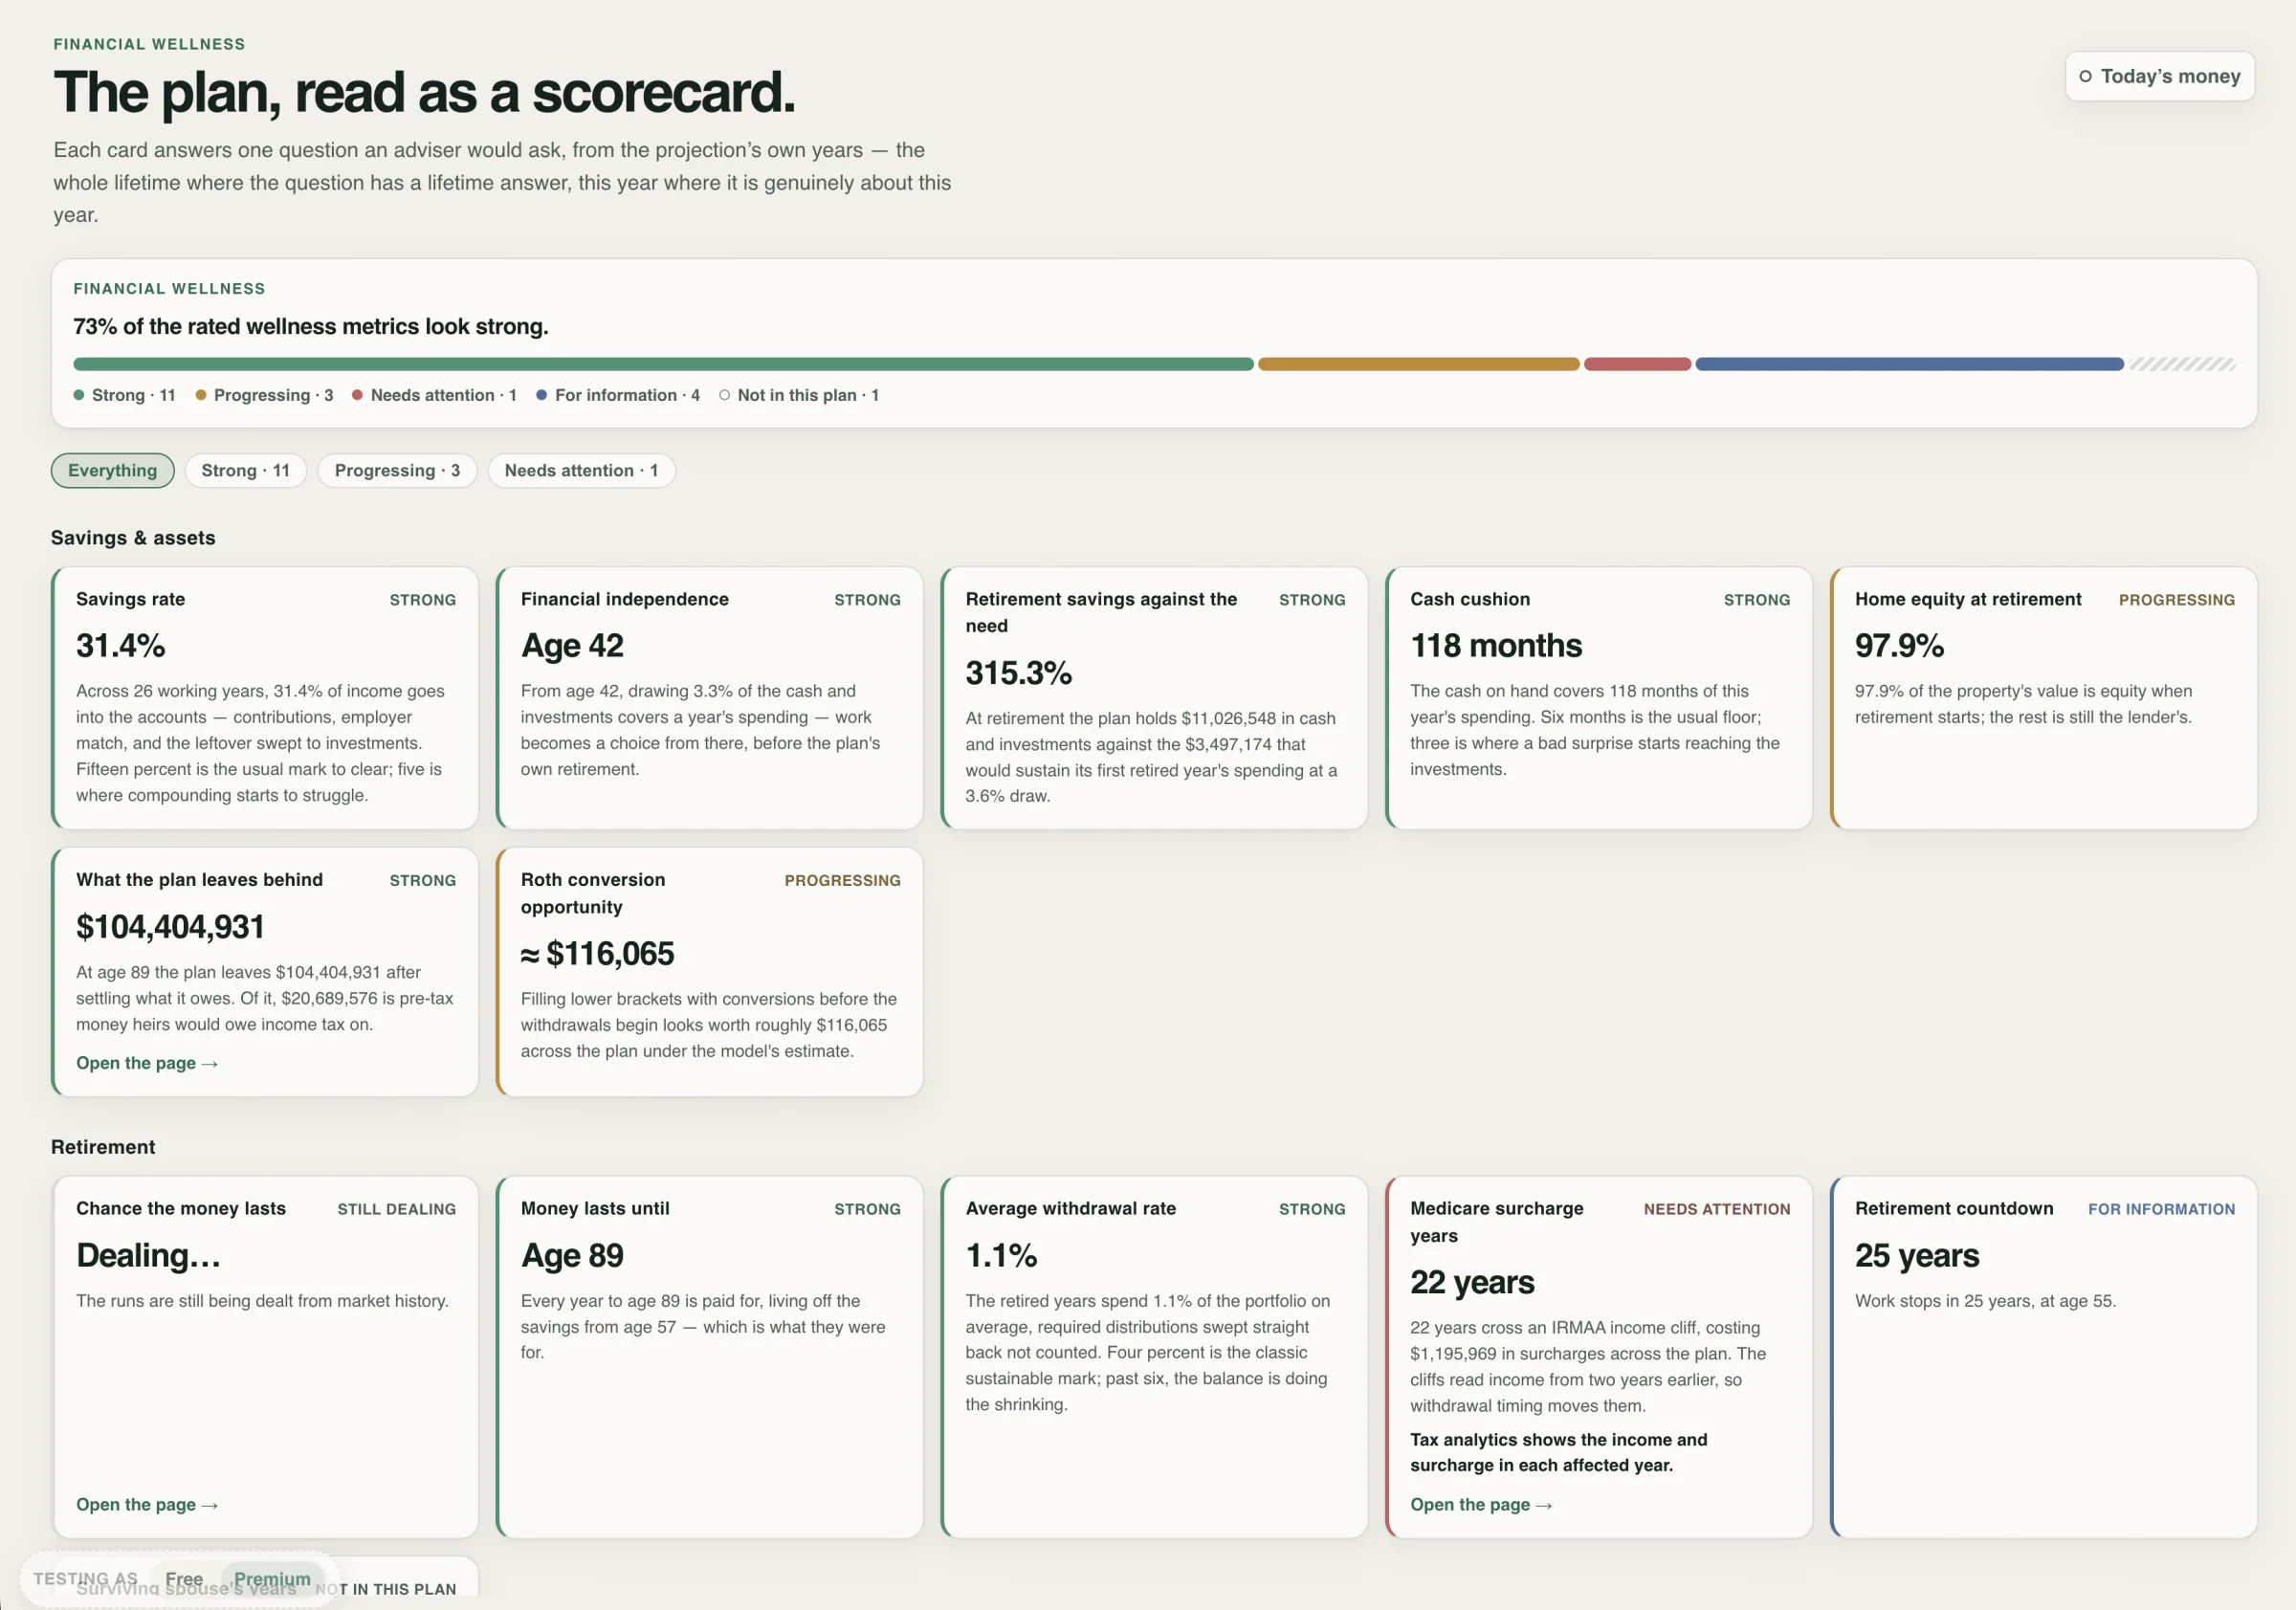
Historical stress test
Reshuffle real market history into hundreds of lifetime sequences. See the range of outcomes, inspect the leanest run, and learn what the headline odds are made of.
Explore historical stress test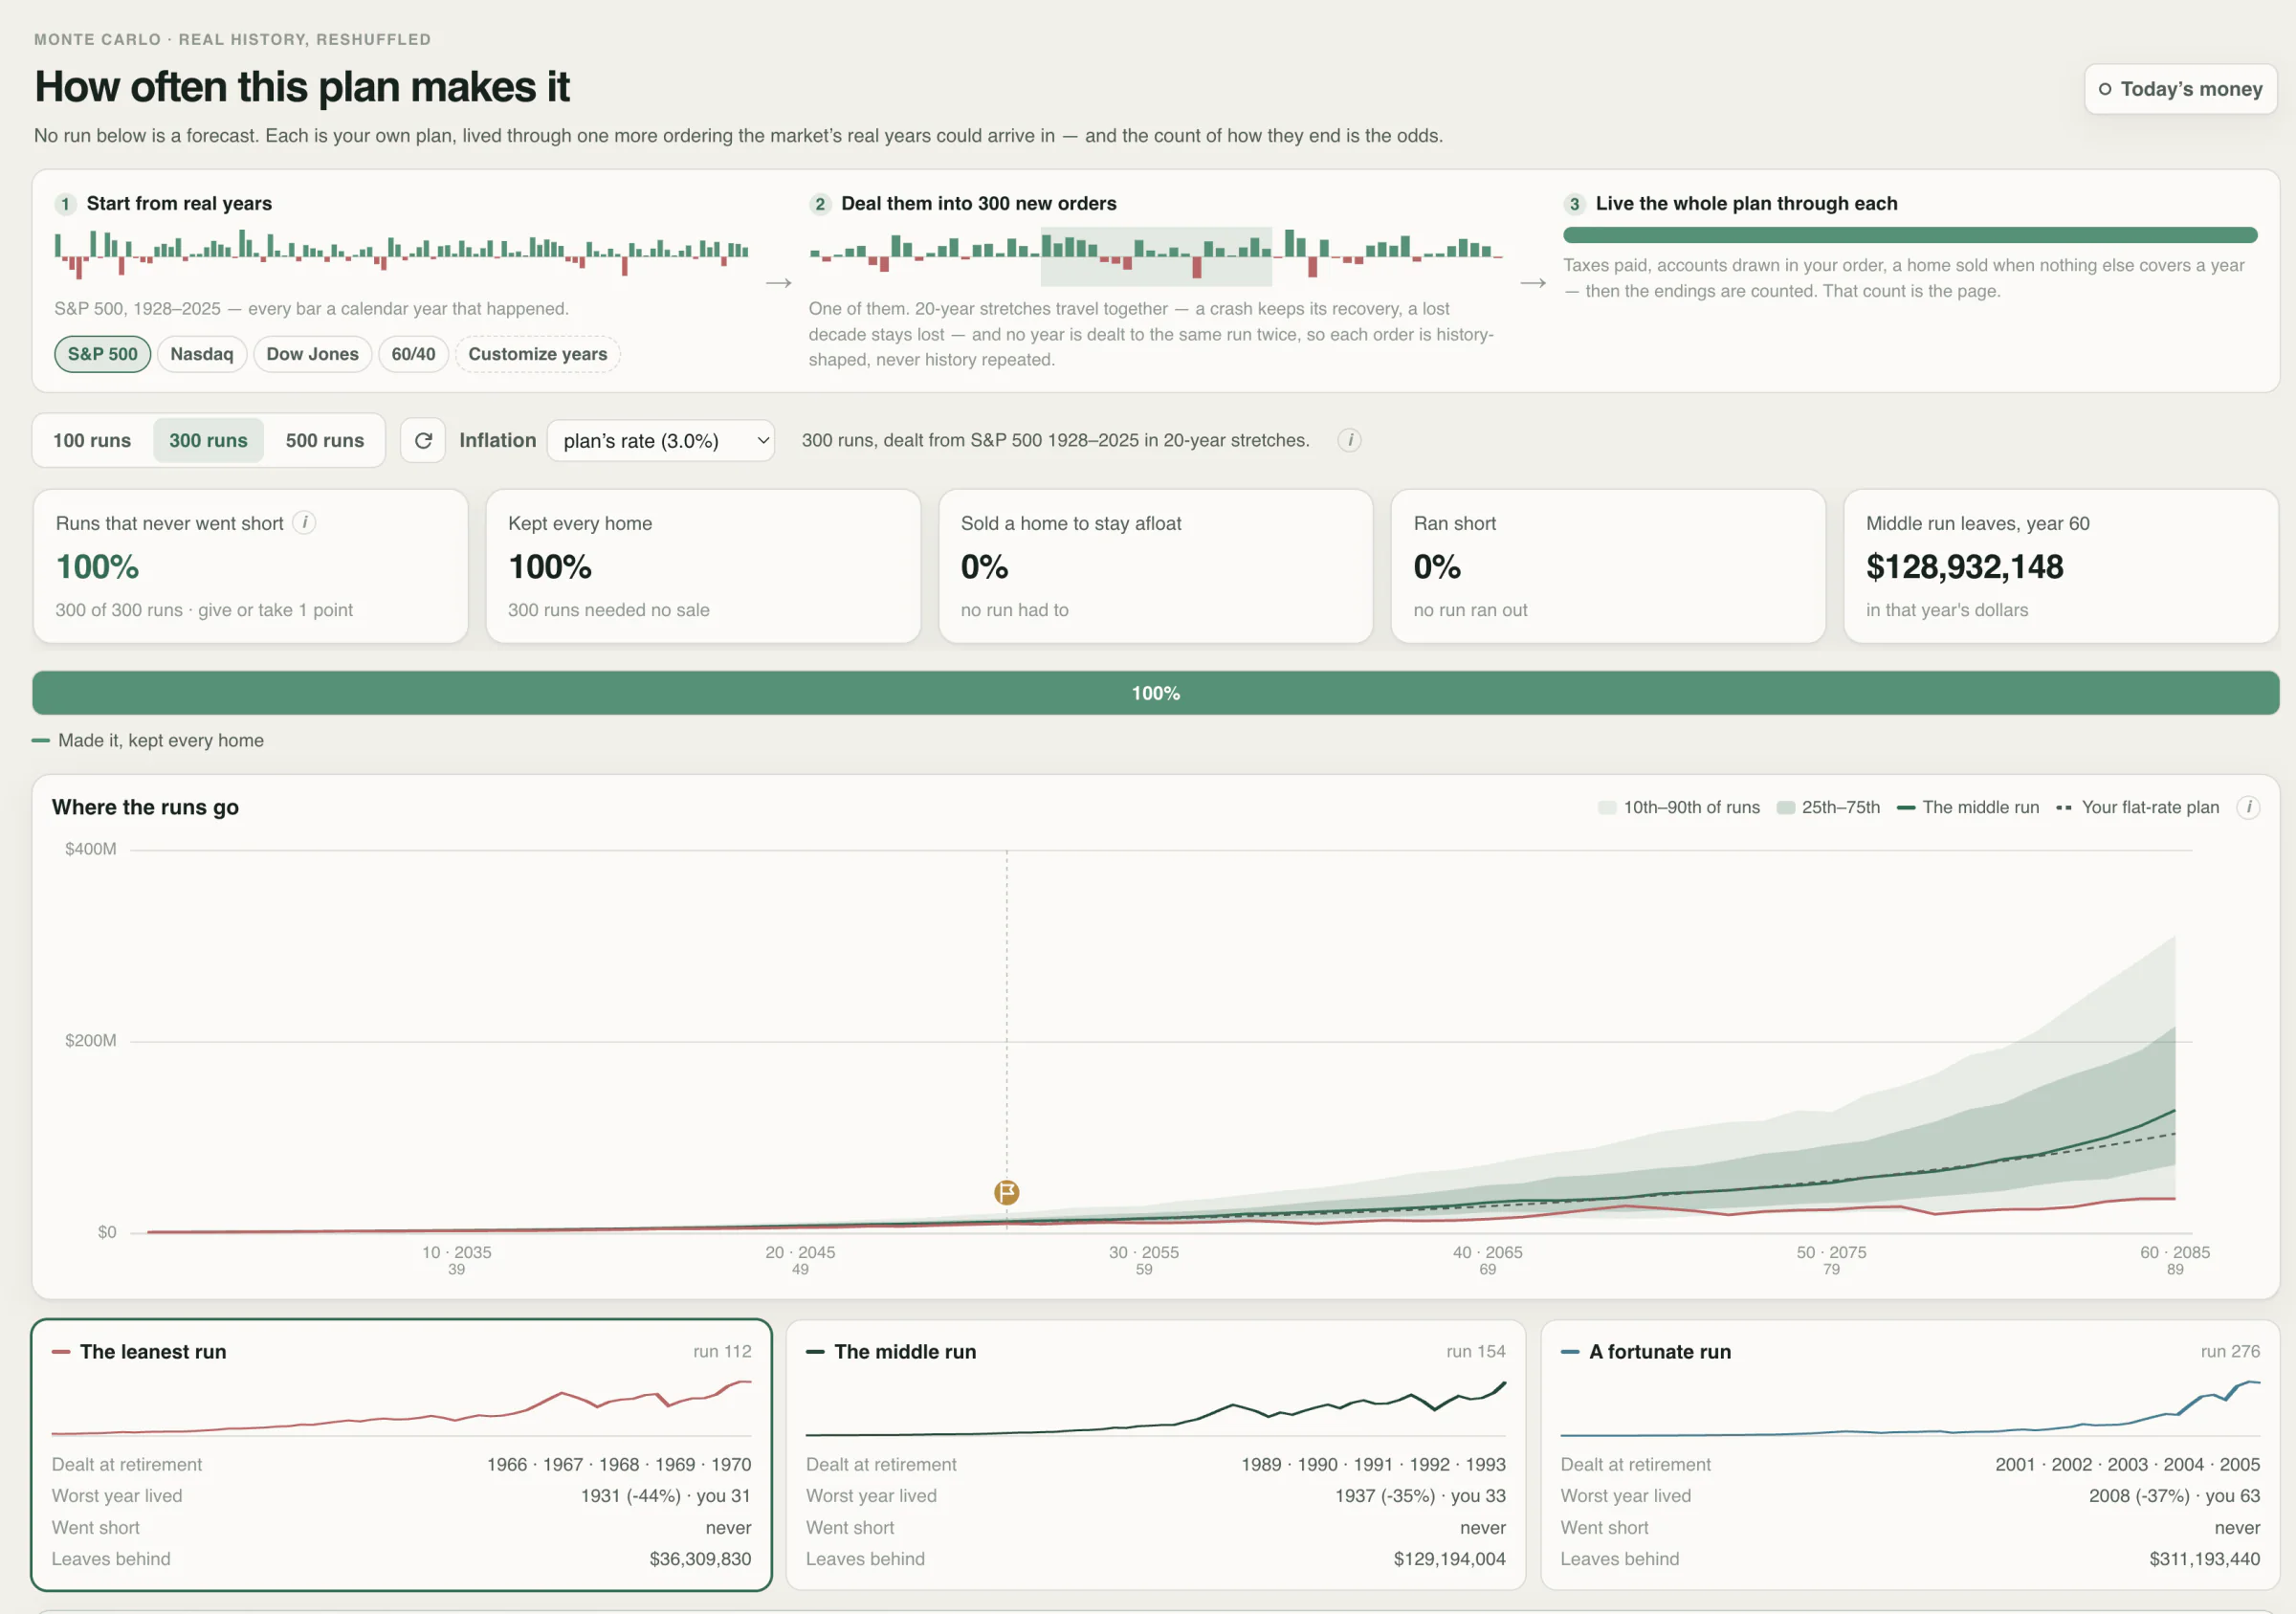
Estate flow
See how each account reaches beneficiaries, taxes, property liquidation, and administration costs. The plan stays connected all the way through the estate.
Explore estate flow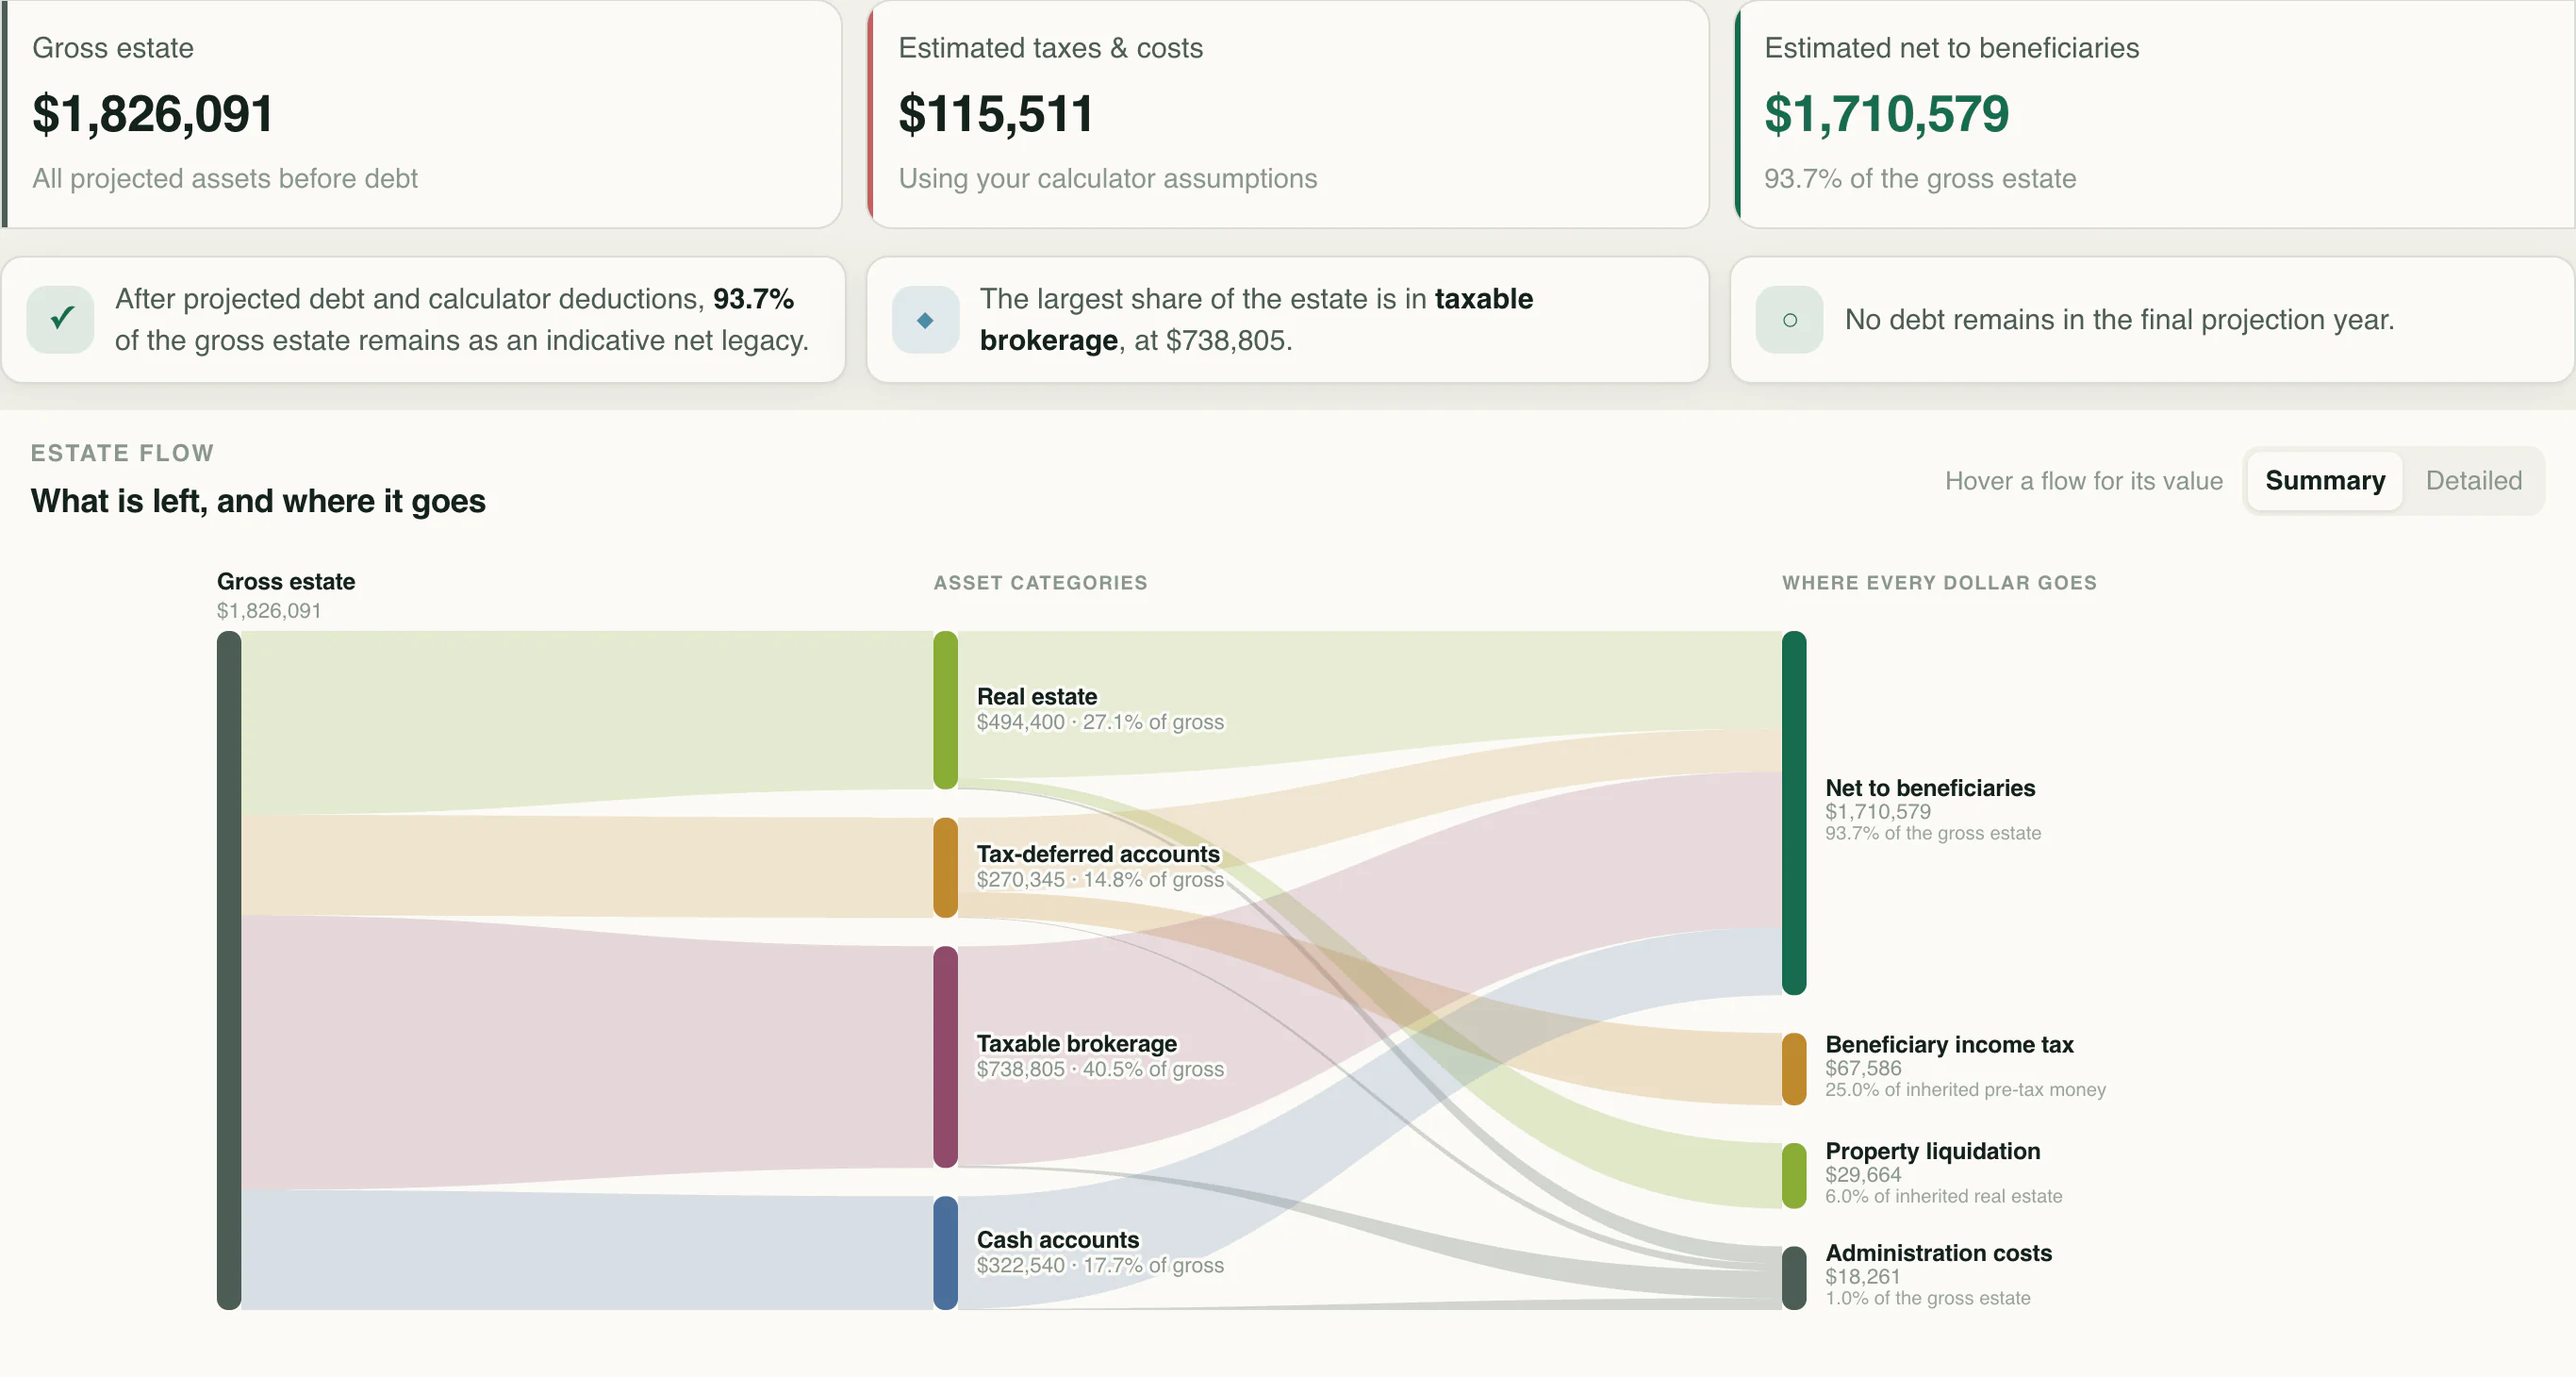
Private sharing
Invite a partner or loved one to a read-only view, or send a link when that is simpler. You decide who can see the plan; they can read it, never change it.
Explore private sharing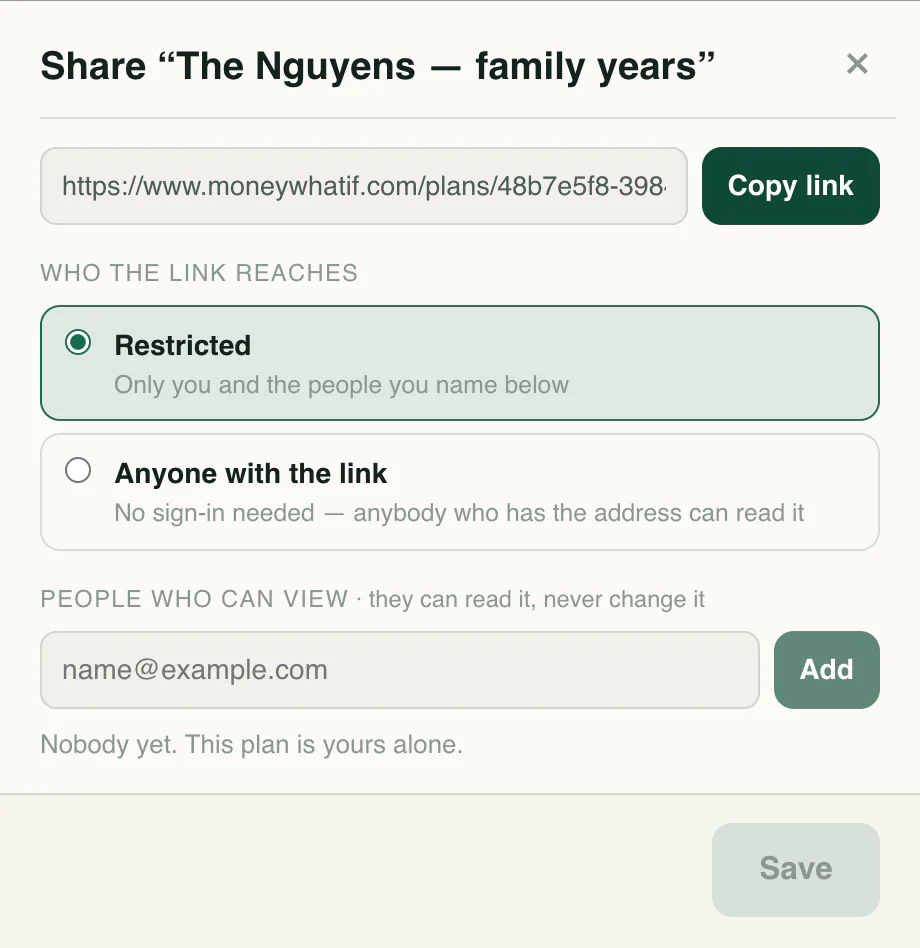
Start with what matters to you
Choose a place to begin. Each feature introduction explains the workflow, shows the product in action, and walks through a practical example.
Connect today’s balances to a lifetime forecast. See how saving, debt, and household milestones fit together before exploring the finer details.
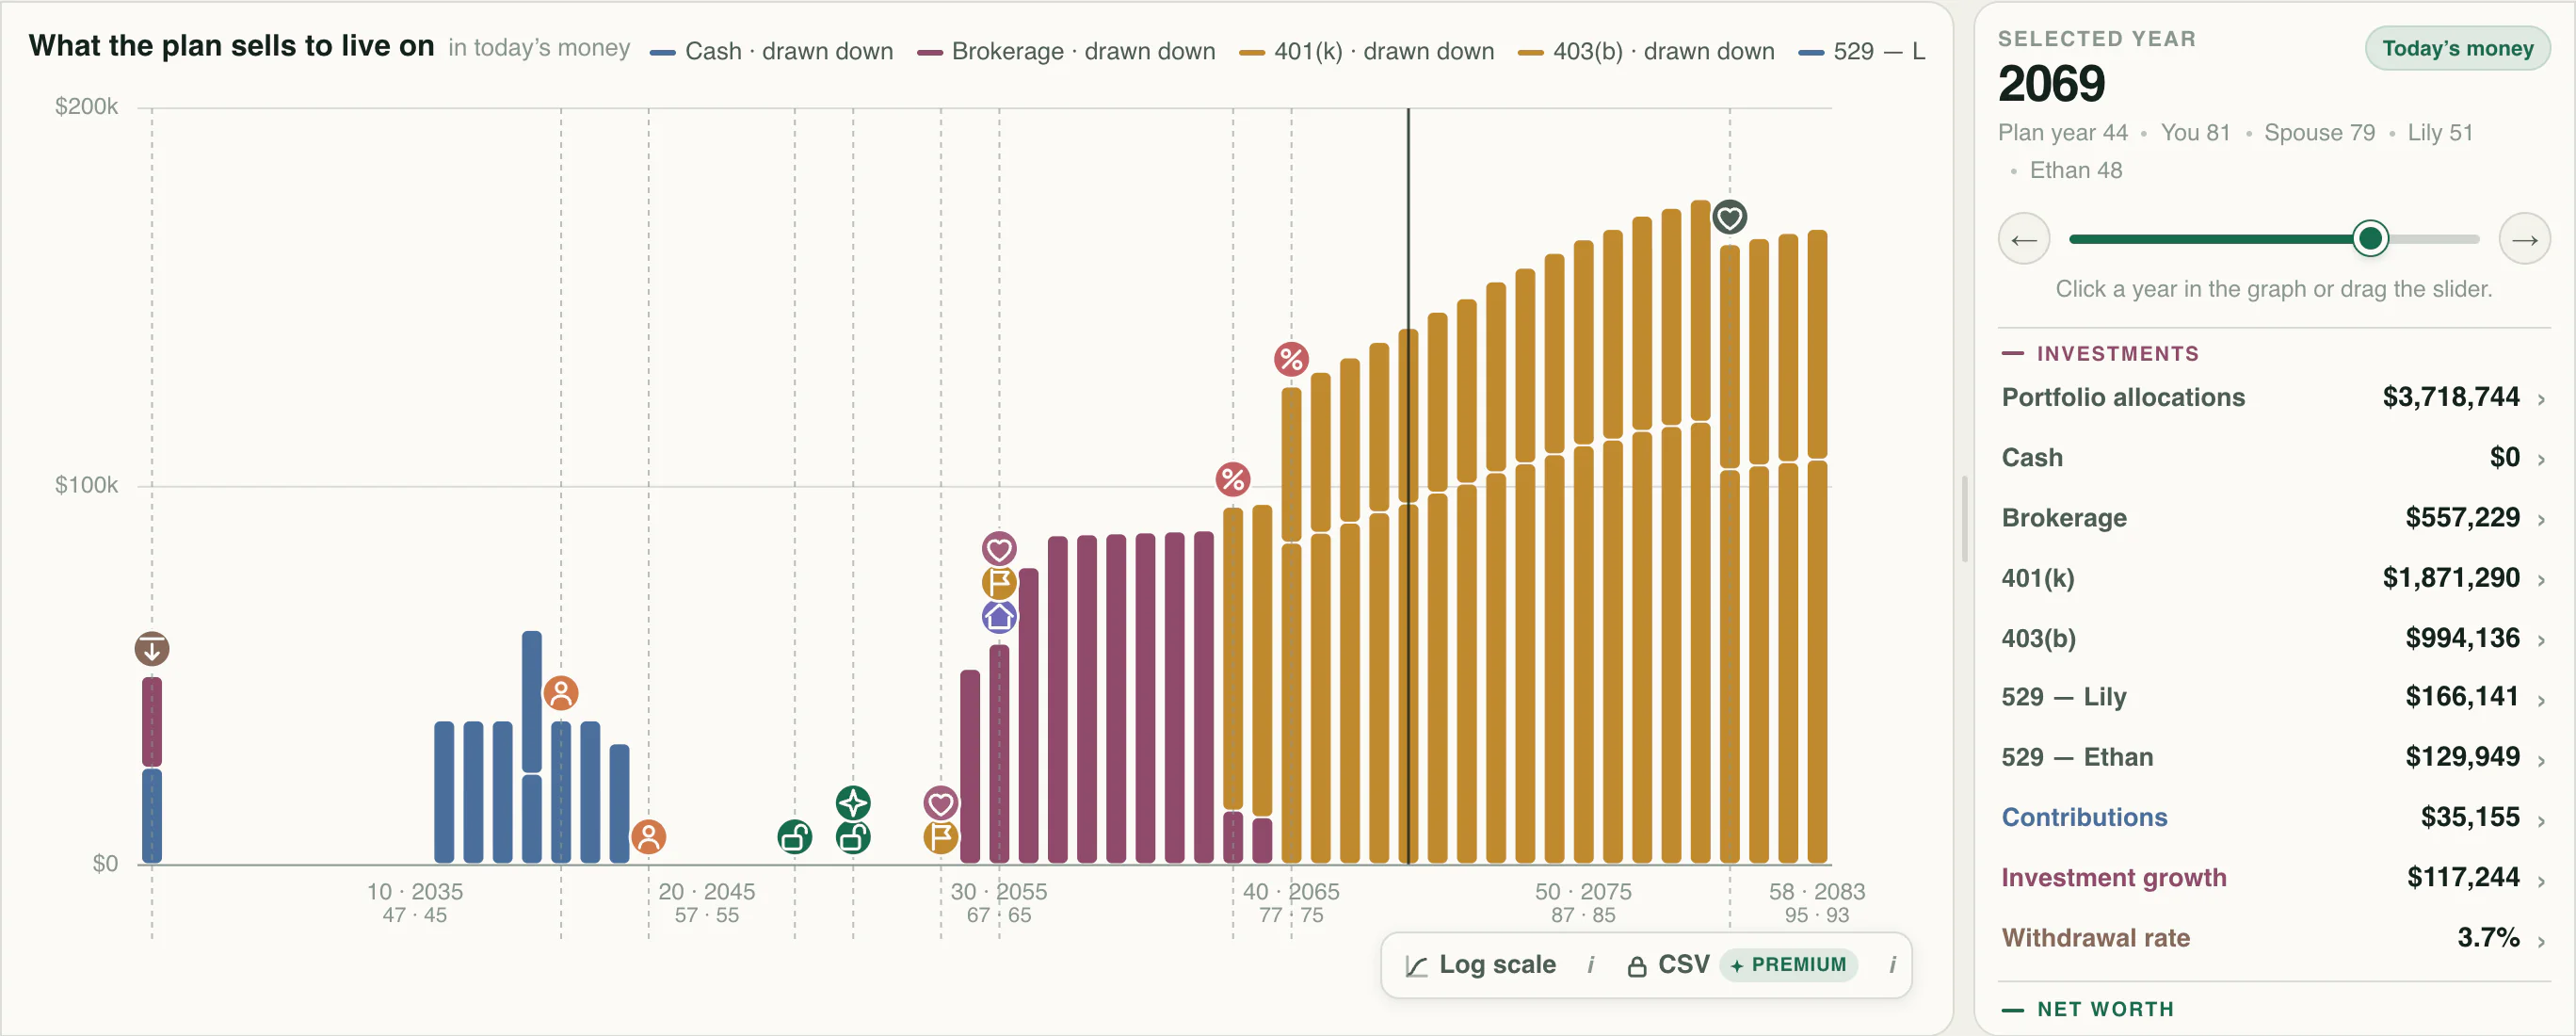
Put retirement timing, benefits, health coverage, and withdrawals on the same timeline. Examine the spending path and how it responds to different markets.
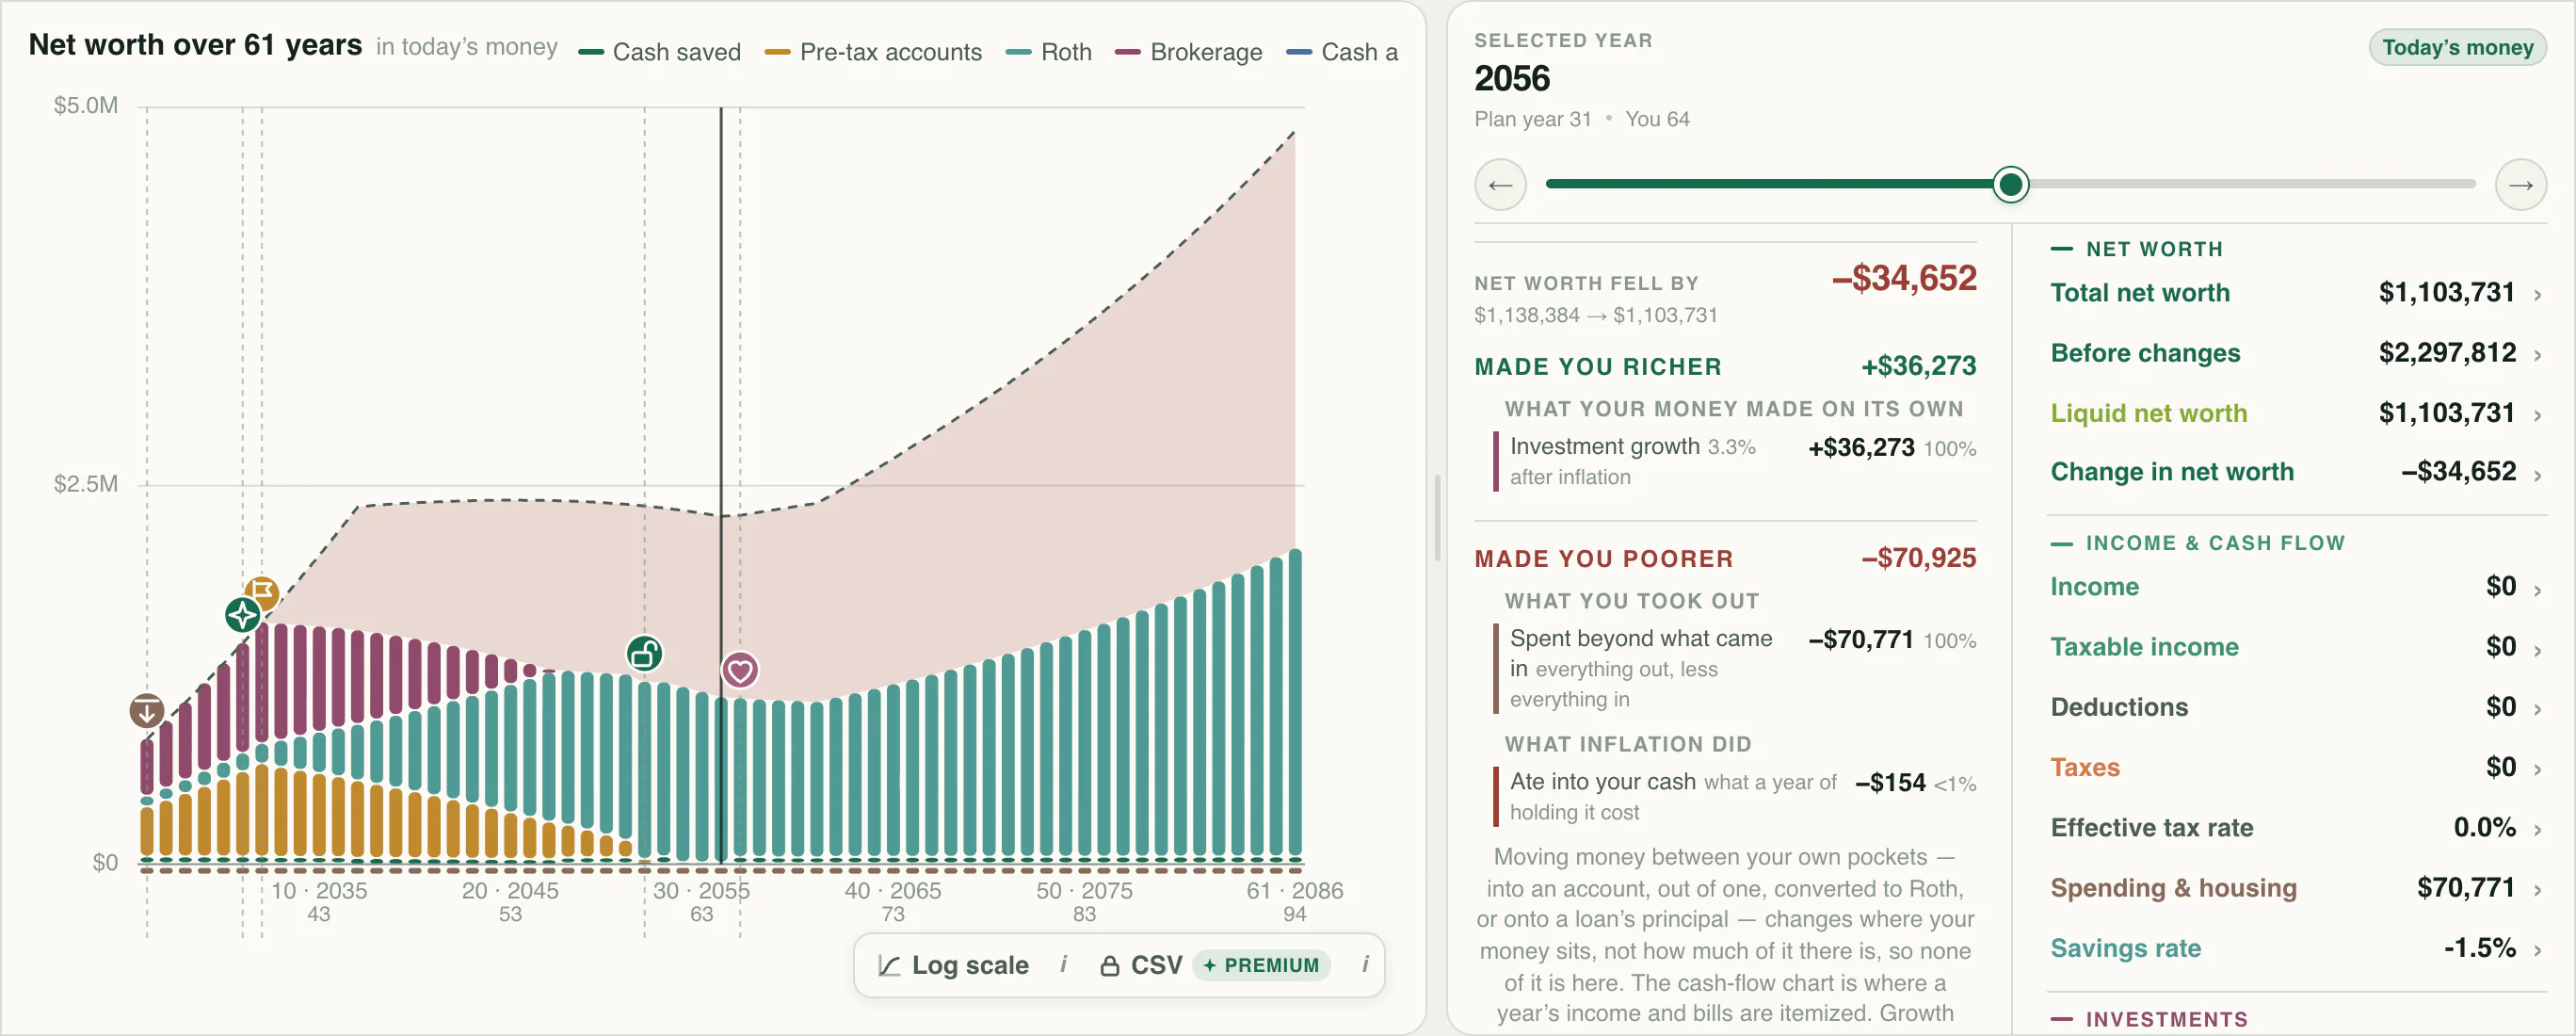
Look beyond the immediate price of a home, a move, or a period with less income. Compare the continuing costs, cash needed, and effect on later choices.
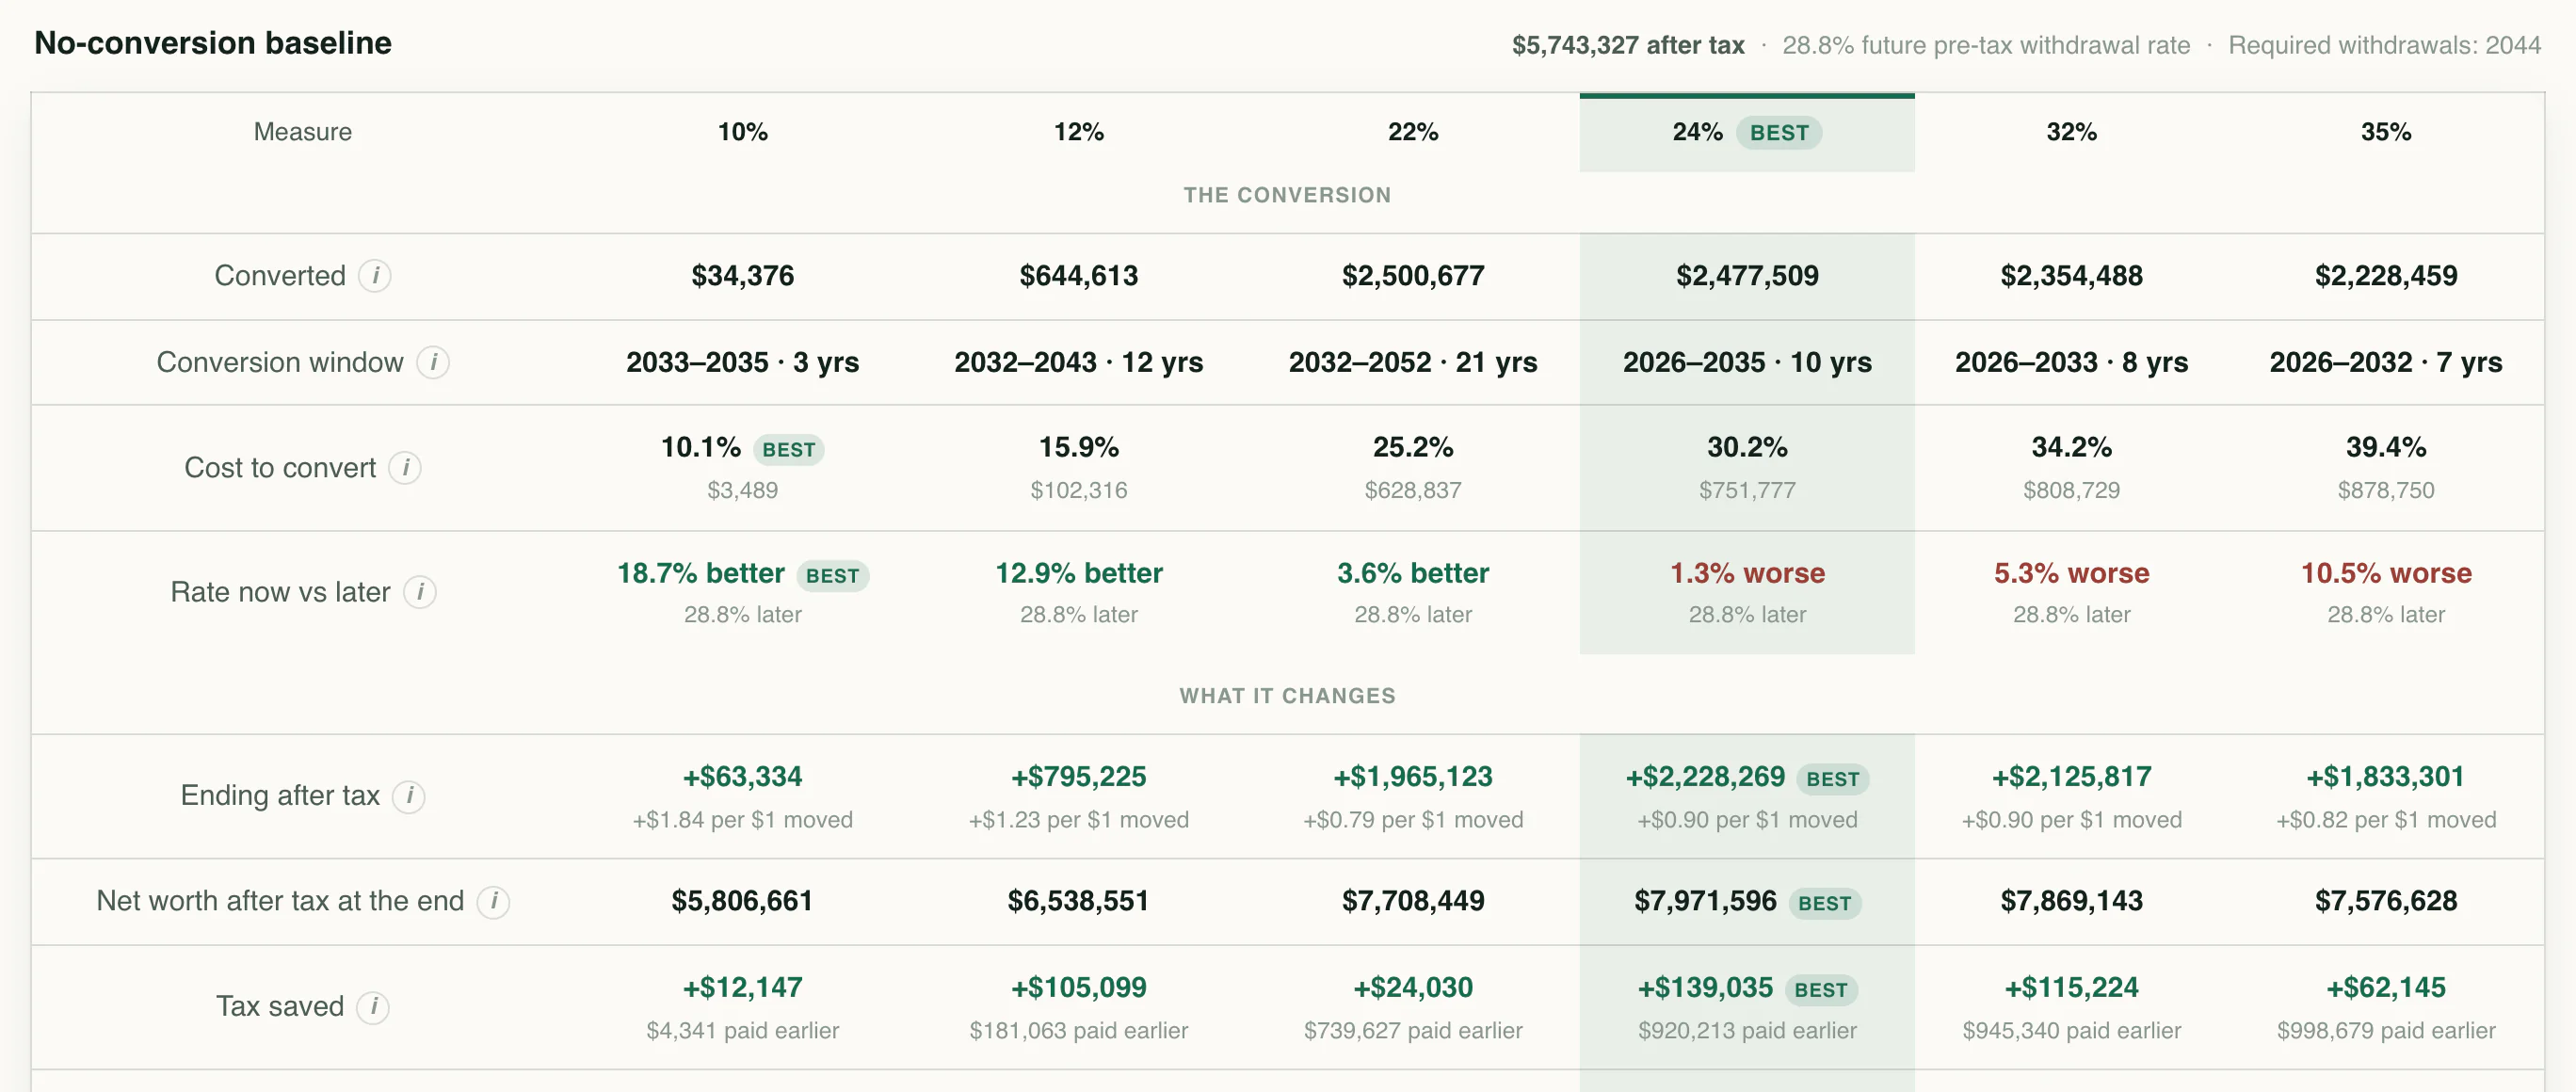
Once the big picture is in place, explore tax timing and combinations of saving and withdrawal choices. Read the proposed changes before applying them.
Keep exploring
Retirement, tax strategies, property, historical markets, and the tools that connect them.
Before your first what-if
A few practical answers about getting started, keeping your numbers current, and understanding what the forecast can tell you.
Start with household ages, annual income and spending, account balances, property values, and amounts owed. Retirement dates, future purchases, contributions, and other changes give the forecast its timeline. The guided setup organizes the inputs, and individual entries stay editable as your assumptions develop.
See how a plan startsYes. The public example plans use invented households at different life stages. Open one to explore its projection, tax picture, reports, and other views. What-If in an example lets you investigate changes before starting with your own household.
Explore example plansA profile keeps a household’s current finances and dated history together. Its plans describe possible futures, with their own retirement dates, contributions, growth assumptions, and other choices. Plans can use the shared household figures as their starting point while retaining their own adjusted entries where needed.
See how comparisons workThe baseline shows what follows from the assumptions you choose. Historical market tools show how the plan behaves across selected or rearranged past returns. Both are modeled scenarios. Review the difficult years, costs, and assumptions behind the result, rather than relying on one ending balance or percentage.
Read the methodologySharing is controlled by the saved access settings. An individual plan can stay Restricted with named viewers or allow anyone with its link to read it. Profile sharing grants named people broader access to the household’s finances and plans, with view or edit roles. Choose the scope that fits the conversation.
Understand sharing controlsYour turn